
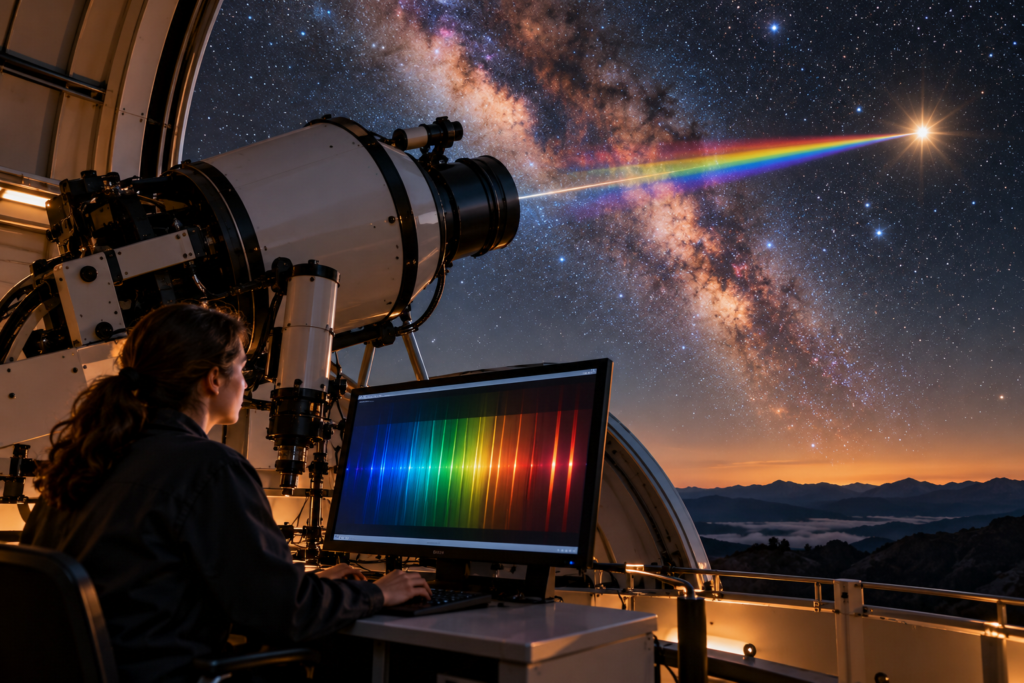
No spacecraft has collected a sample from a distant star. Yet astronomers can identify elements in stars so far away that their light takes years, centuries, or longer to reach us.
The explanation is not that telescopes magnify individual atoms. Instead, the light carries evidence of how matter interacted with it before it began its journey toward Earth.
Reading that evidence requires instruments, laboratory physics, and careful modeling. A star may look like a tiny point, but its light contains far more information than its apparent brightness alone suggests.
A spectrum turns light into something scientists can measure
Ordinary white light can be separated into colors, as a prism demonstrates. A scientific instrument called a spectrograph separates incoming light into wavelengths so researchers can measure the signal in detail.
The result is a spectrum. It can be displayed as a strip resembling a rainbow or, more usefully for analysis, as a graph showing how much light arrives at each wavelength.
Astronomers do not restrict this approach to visible colors. Depending on the instrument and observing conditions, they can investigate infrared, ultraviolet, and other parts of the electromagnetic spectrum.
The important change is from asking “How bright is the star?” to asking “How is its light distributed across wavelengths?”
Atoms interact with particular wavelengths
Atoms have specific allowed energy states. An electron can move between states by absorbing or emitting energy corresponding to the difference between them.
Because a photon’s energy is related to its wavelength, these transitions produce recognizable spectral features. Different atoms and ions have different sets of possible transitions.
In a simplified stellar picture, light from hotter, deeper layers passes through overlying material. At certain wavelengths, that material absorbs light, producing darker features called absorption lines.
Under other conditions, material produces bright emission lines. Both kinds of features can help identify what is interacting with the light.
A dip in the spectrum
Less light reaches the observer at a particular wavelength than in the surrounding spectrum.
A bright spectral feature
Material emits light at wavelengths associated with its available energy transitions.
These patterns are often described as chemical fingerprints. The comparison is useful, provided we remember that a stellar spectrum can contain many overlapping contributors.
Laboratory measurements provide the reference patterns
Scientists can measure the wavelengths associated with known substances in laboratories. Those measurements provide reference information for interpreting astronomical observations.
Suppose a stellar spectrum contains several features at positions consistent with transitions of a particular element. Agreement across multiple features is more persuasive than one apparent match.
Researchers also account for motion. A star moving toward or away from us shifts the observed wavelengths through the Doppler effect. Its spectral pattern moves rather than acquiring an entirely new chemical identity.
Imagine recognizing a melody played in another key. You would consider the relationship among its notes, not just one isolated note. Similarly, astronomers examine a coherent pattern after accounting for the relevant shifts.
This analogy illustrates the reasoning, but the actual analysis uses measured wavelengths, uncertainties, and physical predictions rather than subjective resemblance.
Finding an element is different from measuring how much exists
Identifying iron in a star does not tell astronomers what fraction of its atmosphere consists of iron. Presence and abundance are separate questions.
A prominent line does not automatically indicate that its element is the most common ingredient. Line formation also depends on the transition involved and the physical conditions of the material.
To estimate abundances, researchers compare observations with calculations of stellar atmospheres. These models describe how light is generated, absorbed, and transported through the layers being observed.
| Question | Evidence and interpretation |
|---|---|
| Which ingredients are present? | Compare spectral features with known atomic and molecular transitions. |
| What conditions produced the features? | Examine temperature, ionization, pressure, and other atmospheric properties. |
| How abundant is an element? | Determine which model abundances best reproduce the observed spectrum. |
| How certain is the result? | Evaluate measurement quality, blending, assumptions, and model limitations. |
The process is therefore closer to solving a physical model than reading percentages directly from the depth of a dark line.
Temperature can make the same element look very different
Temperature affects the energy states occupied by atoms. It also affects ionization: whether an atom retains its electrons or has lost one or more of them.
Those changes influence which spectral transitions can appear strongly. Two stars with similar chemical compositions can therefore display noticeably different spectra.
NASA’s educational material demonstrates this with stellar spectra and laboratory comparisons: differences in line strength need not mean equally large differences in chemical composition.
Molecules provide another illustration. Conditions in cooler stellar atmospheres can allow molecular features that would not persist in the same way in hotter environments.
Cecilia Payne helped reveal the stars’ dominant ingredients
The difference between line strength and abundance played a major role in a landmark discovery.
In her 1925 doctoral research, Cecilia Payne, later known as Cecilia Payne-Gaposchkin, applied physical understanding of temperature and ionization to stellar spectra.
Her work showed that hydrogen and helium, especially hydrogen, dominate stellar composition. This challenged the expectation that stars had relative elemental abundances broadly resembling Earth’s.
The result illustrates why collecting a spectrum is only part of the task. Interpreting the evidence with the right physics can change the conclusion dramatically.
Stars contain additional elements, and their abundances vary. “Mostly hydrogen and helium” does not mean every star has an identical composition.
A spectrum reveals the observable layers, not a complete interior sample
Ordinary stellar spectroscopy primarily investigates the layers from which the measured radiation emerges and through which it passes.
It is not a direct inventory of every region inside a star. Conditions in the core can differ greatly from those in the atmosphere.
Scientists use additional observations and models to investigate stellar interiors and evolution. Surface composition is valuable evidence, but it should not be confused with physically sampling the core.
Measurements also have uncertainties
- Some features overlap. Several spectral lines can blend, making their individual contributions harder to separate.
- Instruments have limits. Spectral resolution and signal quality affect what can be measured.
- Other material can intervene. Earth’s atmosphere or material between us and the star can add features that need to be distinguished.
- Models require assumptions. Estimated abundances depend on how accurately the calculations represent the observed star.
These limitations do not make the method guesswork. They explain why results include uncertainties and why researchers compare multiple observations and methods.
Frequently asked questions
Can scientists identify elements without visiting a star?
Yes. Spectral features can be compared with laboratory measurements. The same physical transitions that affect light in a laboratory also provide clues in astronomical spectra.
Does a star’s color reveal its exact composition?
No. Overall color is strongly connected with temperature and can also be affected by intervening material. Detailed chemical analysis requires more than identifying a visible color.
Are dark absorption lines completely missing light?
Usually they represent reduced intensity compared with the surrounding spectrum, not necessarily zero arriving light. Their depths and shapes contain information.
Is the element with the strongest line always the most abundant?
No. Temperature, ionization, transition properties, and other conditions influence line strength. Abundance estimates need a physical interpretation of those effects.
Does spectroscopy tell us what is in a star’s core?
Ordinary stellar spectra do not directly sample the core. Scientists combine evidence and stellar models to investigate regions that cannot be observed directly.